In the last article we demonstrated how to get started with the MapKit framework. We demonstrated how to plot the user's current location, display annotations and change the display of annotations using the annotation view. This article will focus on consuming XML data from a feed and displaying information from the source on the map.
Recommended Reading:

If you have never worked with the MapKit framework before then it is highly recommended that you check out the previous article in which we explained in detail how to get started with the MapKit framework.

Scenario:

We will be consuming XML data from the Socrata service which provides important public information about different cities of United States. There are many feeds available through the Socrata service. We will be focusing on displaying the greenest cities of United States.

Examining the XML Data:

The first step is to explore the XML data that will be consumed by our application. Visit Socrata and then filter the search by "Maps" and in the search box type "Houston". The first search result will be "America's Greenest Cities". Click on that and then click on the "Export" option. This will provide you with a list of options including JSON and XML. Click on XML and it will present you with an XML feed. a small portion of XML feed is listed below:


As, you can see Los Angeles, CA ranks at number 1 for the greenest city in United States. The most important information for us is the latitude and the longitude since it will be used to plot the annotations of the map. In the next section we are going to consume the XML feed and populate our custom objects with the information contained in the feed.

Parsing XML and Populating Custom Objects:

We are going to utilize NSXMLParser to parse through the XML feed. The GreenCitiesService is responsible for returning an array of custom feed objects.


The GreenCitiesService implements the NSXMLParserDelegate which illustrates that GreenCitiesService will handle the callback events generated by the NSXMLParser class. The complete implementation for the GreenCitiesService is shown below:


The code is pretty self explanatory! The GreenCity class is our custom class which holds the information about the XML feed. This information consists of name, latitude, longitude and rank of each city. In the next section we are going to plot all the information we have gathered on the map.

Plotting Greenest Cities on the Map:

We are going to load all the green cities inside GreenCitiesAppDelegate. The green cities are inserted into a NSMutableArray called "greenCities". The didFinishLaunchingWithOptions method calls the GreenCitiesService to load all the cities as implemented below:


The next step is to iterate through our greenCities collection and plot all the cities on the map. The didUpdateUserLocation method is implemented below:


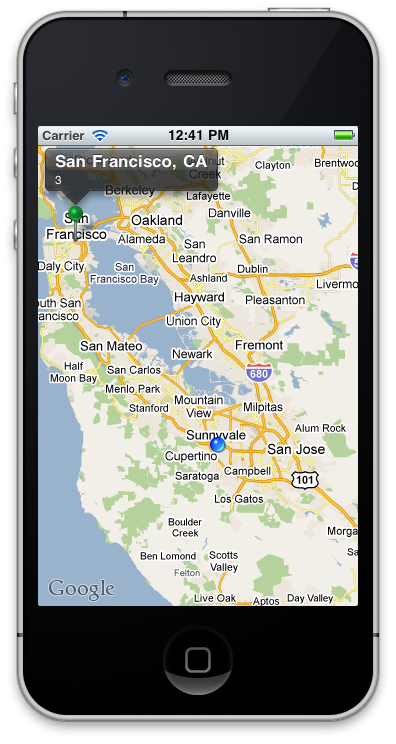
The screenshot below shows the result:


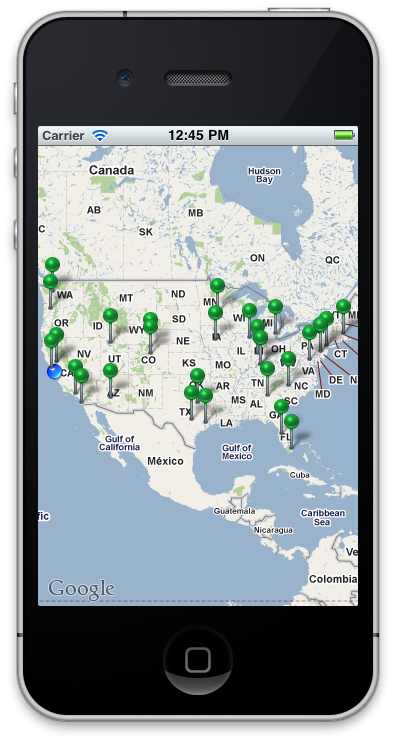
Pretty cool! Unfortunately, we are not able to see all the green cities since we are focused on the user's current location. The following code finds the minimum and maximum values of the latitude and longitude and then span the region to show all the annotations plotted on the map.


The effect is shown below:


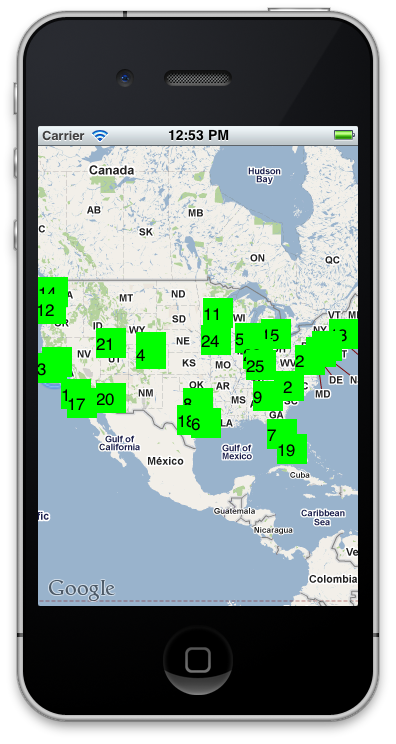
This gives the user an eagle eye display of all the greenest cities in the United States. As shown in the XML feed each city is associated with a rank. We can even create our custom view which shows the ranks on the map.

The GreenCityAnnotationView is a custom view which draws the rank of the green city on the map. The following screenshot shows the GreenCityAnnotationView in action.


Ugly, but you get the picture right!

Conclusion:

In this article we demonstrated how to consume XML feed using NSXMLParser class and then display it on the MKMapView control. We also learned how to resize the visible region so that the user can see all the information without having to zoom in or out.

[Download Sample]